
So, what is the stock market all about? You may have heard you're friends talk about "The Market or Stock Market" at dinner, sentiments like bull market and bear market are all what makes the market tick. The term is fairly self-explanatory – it's where shares of publicly traded companies are bought and sold. The concept of demand and supply is evident here where there is a buyer a seller is always nearby.
What does stock mean, stock is the ownership in the stake of a Company. For instance if you purchase a share of John Keells Holdings you acquire a tiny slice of the Company, thereby having a viable interest in the growth and stability of the Company. In other words you own a slice of the profit for every rupee that JKH earns – a "piece of the pie" so to speak.
Let's start from the beginning, more than 100 years ago brokers would shootout, "I have 100 shares of Company X for sale, how much will you offer me?" If a broker had an order to buy some shares he would shout, "Someone sell me 100 shares of Company A! Who has the best price?" In modern conditions, traders would yell offers and bids on the trading floors in a seemingly chaotic fashion. Market trading is more organized now; this is facilitated through computers doing the actual shouting.
Fluctuations in the prices of a stock arise for a variety of factors. While companies are expected to earn a profit, when investors think that profits will increase, the stock price may go up. If good news comes out on a company, the price and demand for the stock may go up. With negative news, the price and demand may go down. The price of a stock is also affected when the demand is very high or very low. As a result it is important the more you know about trading the more prepared you will be. We believe the key to successful trading is creating a trading plan and maintaining the discipline to trade the plan. This can be achieved by using the tools provided here at ATrad.
In order to trade stocks on an exchange, you need to have an account with a brokerage firm that will place buy and sell orders on your behalf. You can execute an order either by calling a broker or speaking directly to the broker, however the trend nowadays is to trade online unassisted. In all aspects of placing orders the broker acts according to your wishes and places your trades for you. In the past exchanges conducted business through public outcry in a physical trading floor named the "pit"; this has been replaced nowadays by electronic order execution via your desktop or laptop computer in the convenience of your home. This has allowed quick execution of many millions of shares with greater speed and efficiency than ever before. Today there many new publicly quoted companies trading as a result of IPO's, it is sometimes difficult to keep track of all the publically quoted companies trading on the Colombo Stock Exchange. As there are many companies traded on the CSE, the exchange has divided these companies into business sectors for organization purposes.
SECTORS
Sectors are simply broad market categories found within the marketplace. Technology, Financial and Food & Beverages are examples of sectors in the CSE.
![]()
INDICES
The stocks on the CSE are further classified into Indices. An index is a basket of stocks assembled to represent some section of the broader market. For example, the Food, Beverage and Tobacco index is made up of 18 different stocks in the Food, Beverage & Tobacco sector. The All share price index represents a broad view of the market by including all the stocks from across the business sectors. Alternatively, the Milanka Price index represents a different view of the broad market, and consists of a select group of 25 stocks traded on the CSE. Whenever you hear market commentators refer to the "ASI" or the "MSI" (Milanka Price index) they're referring to the performance of the particular list of stocks created by ASI or by MPI. These lists change periodically, with the intent of following the stocks most representative of certain aspects of the market at a given point in time.
Deciding when you should or shouldn't place a trade depends heavily on what the current markets are doing. Once you have a handle on current market conditions, you can begin to identify the tools and strategies you're going to use to place a specific trade.
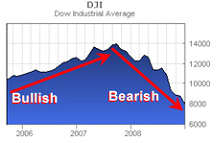
No one really knows the origin of the terms "Bullish" and "Bearish" in the context of market trends, but you can certainly find several interesting sources suggesting their heritage. Regardless of where they riginated, Bullish universally indicates an optimistic outlook, while Bearish refers to a pessimistic one.
Bullish Market Forecast = Rising Stocks
Simply put, if you think the markets are going up in general (that is, you're bullish on the markets) then you want to find stocks and strategies best suited to capitalize on the positive price movements.
Bearish Market Forecast = Falling Stocks
If you think the markets are falling in general (you're bearish on the markets), then you want to find stocks and strategies that are more likely to succeed when prices fall.
Keep in mind, however, that one of the fascinating aspects of the stock market is that even if the overall markets are Bearish, you'll still be able to find a number of stocks that are actually increasing in value contrary to the overall market trend. An example of this phenomenon is when one sector does well as the rest of the market suffers in light of certain factors that influence the stocks in that sector to do well. The important thing to keep in mind is that there are often a number of stock investing strategies that work to generate profits regardless of market direction.
A share of stock represents ownership, plain and simple, and is often referred to as a shareholder's equity stake in a firm. While much has changed in the stock market over the years, from the extinction of paper stock certificates to the move to decimal pricing, the core principal of stock investing remains - the opportunity to own a piece of a company.
Common stock investors receive voting rights in connection with their ownership stake, and some may receive dividend payments as well. Like any other investor, however, their main hope is often that their shares may increase in value as an investment - the company will perform well, more investors will be attracted to the stock and their purchases will drive up the price. Similarly, while owners of preferred stock may not be entitled to the same say in company affairs, they generally receive higher guaranteed dividend payouts, and, again, the possibility of share price appreciation.
In addition to individual investors, other stockowners may include insiders such as executives, individual directors or employees, as well as large institutions like mutual funds and pension or retirement accounts. Given their level of access and analytical resources, some investors believe that tracking insider and institutional activity in a stock can provide a good window into a company's prospects. However, the buying and selling among insiders and institutions is not always the clear-cut sign that it would appear to be, so it is often more prudent to view this information as merely one facet of a deeper analysis.
In terms of its stock, a company is generally classified in terms of its market capitalization, or "market cap," which is calculated by multiplying its share price by the number of shares outstanding. Small-cap and Mid-cap companies are those not classified in the MPI (Millanka Price Index) with capitalization less that Rs.296 million and large-caps - or "blue chips" - are those generally above Rs. 296 million.
Stock investors often go long in the market by buying shares in anticipation of a price rise. However, in other global markets (CSE not included) it is just as possible to be short by borrowing shares to sell now in the belief that the stock is headed downward, and therefore can be bought back later at a lower price. Going short still holds to the tried-and-true principle of buying low and selling high, but simply reverses the order to take advantage of a situation where a stock may be falling.
As simple and streamlined as it appears, every stock transaction actually involves a number of different parties, each with an important responsibility in the process. An individual or institutional investor gets the ball rolling by expressing interest in buying or selling shares of a company. In order to place the trade, the investor contacts a broker, who accepts the order and earns a fee or commission for sending it into the market on behalf of the investor.
A dealer at the exchange helps provide liquidity in different stocks by accepting orders as he buys or sells for his firm's account and tries to make money on the spread between the bid and ask prices. Finally, a trader on the floor actually executes the transaction, buying from or selling to other traders for his own account.
Shares of stock do not have an absolute value, or set worth, at any given point in time, but rather are continually subject to the opinion of the marketplace, in which other shareholders weigh in on the outlook for the company by buying or selling the stock. If an investor believes that a particular stock is undervalued in the market based on his or her analysis of its performance or potential, it may be a good candidate to buy before the market bids it up. Conversely, an overvalued stock is one whose share price is not supported by its fundamentals in the eyes of an investor, and therefore may be ripe for a fall when the market catches up to the reality of the situation.
Historically, the stock market has tended to operate within certain cycles of activity. A bull market is a long-term period in which stock prices are generally rising, while a bear market is just the opposite – a period of mostly downward-trending prices. When neither bulls nor bears are dominant over a given time, the market is said to be in a neutral cycle. Cyclical stocks, such as travel companies and automobile manufacturers, are those that are known to rise and fall in virtual lockstep with these different market trends. Some sectors, on the other hand – including utilities and consumer staples – are considered non-cyclical, or mostly unaffected by market cycles. Investing successfully in cyclical stocks requires a good sense of market timing in order to buy and sell in accordance with the alternating bull and bear cycles of the general market.
Stock investors are usually drawn to the possibility of two types of returns. Capital gains are returns that come from appreciation in the share price, and are realized only when one ultimately sells owned shares or buys back shorted stock for a profit, while dividends are portions of corporate earnings that are paid out directly to shareholders by the company. Only dividends are taxable in the year the payment is made. Investors trying to assemble a portfolio of stocks often focus on diversification, investing in a mix of stocks representing different sectors and risk profiles. The goal of diversification is to minimize the impact of an adverse move in any one stock by spreading the risk among a variety of issue.
Any stock portfolio may include a mix of income stocks, which pay dividends; growth stocks, which are shares of generally smaller firms that reinvest profits rather than paying dividends; and value stocks, which are undervalued in the market, based on the company's fundamental characteristics, and thus may represent a bargain for investors.
When evaluating a stock, most investors tend to start by looking at the general health of the underlying company and its industry before moving on to the literally dozens of possible financial statistics and ratios associated with the share price. Together, these are some of the basic analytical pieces that comprise the fundamentals of a stock:
Volume
The number of shares traded in a given session provides a snapshot of a stock's liquidity. In general, the higher the daily volume, the less likely a stock will be subject to extreme volatility and wild price swings.
Net change
The change in price - in rupees - from the previous day's close.
EPS
Earnings per share, or the company's net income divided by the number of shares outstanding, boils the net income number down to the shareholder level.
P/E
The price/earnings ratio - calculated by dividing the share price by EPS - can help indicate whether a stock's price is high or low relative to its earnings. A company with a very high P/E ratio may be overvalued in many investors' eyes.
PEG Ratio
This is a modified P/E calculation that helps determine whether a high P/E may, in fact, not be such a bad thing by taking into account the company's prospects for growth. PEG is probably more useful than P/E when looking at smaller companies.
Debt and Debt/Equity
Is the company highly leveraged? Too much debt can put a company on a shaky foundation. These figures can help explain how much of a company is built upon both short- and long-term debt obligations.
P/S
Similar to P/E, price to sales is instead a revenue measure that divides the share price by sales per share. P/S can be more valuable than P/E when evaluating young companies that may be performing well, but have little to show in the way of earnings just yet.
Book value / share
The book value of the company (assets minus liabilities) divided by the number of shares outstanding.
Price to book
A helpful tool for weeding out stocks that may be considered undervalued or overvalued, price-to-book is calculated by dividing the current share price by the book value per share.
Operating Margin
How efficiently is a company running? This calculation of operating income divided by total revenue can tell how well a particular company manages its fixed costs to deliver gross margin.
ROA
The Return on Assets figure - calculated by dividing net income by total assets - can tell an investor how much profit a company generated for each dollar of assets.
FCF
Does this company have the means to pursue new acquisitions or business ventures? It's tough to grow and expand without a healthy free cash flow, which represents operating capital minus capital expenditures.
Short Ratio
A figure calculated by dividing short interest - that is, investors looking to sell - by the average daily volume in a stock. Many investors see a higher short ratio as a signal of an impending upward move, as short sellers may come in as buyers to cover their positions. This is however still not practiced on CSE due to restrictions imposed on short selling.
Beta
A popular ratio used to gauge a stock's price volatility in relation to the rest of the market. Investors with weak stomachs may not have the constitution to endure a high-beta stock.
Net Income
A firm's gross income minus expenses is the "bottom line" in any analysis. Quite simply, is the firm making money?
Return on Equity (ROE)
Dividing net income by book value, ROE helps determine how efficiently a company is using its assets to produce earnings.
So you want to trade stocks online but are not sure of how to start or what trading strategy to use. ATRAD makes trading simple, through it's easy to maneuver screens it empowers the investor to make prudent investment decisions.
Making money on the stock market seems like it can't be too hard, after all there are plenty of traders making a good living and they aren't any smarter than you. ATRAD market watch will provide you with free information on how to trade stocks; we have nothing that you need to buy to get to the "secrets". How do you trade stocks online then?
First you need to sign up with an online stockbroker. There are plenty of them around – you need one that offers real-time prices, real-time charts, real-time information and news and that is cheap – a few rupees a trade is all you need to pay. ATRAD online ensures that you have all the data you need at your fingertips!
Secondly when trading stocks, take care! It is easy to lose money, particularly if you are a beginner, so start off with small trades, or with dummy (pretend) trades just to see what would have happened if ….. etc…
Your aim is clearly to make money and you can indeed make money fast, but you must also limit your risks. So don't go nuts! Not every trade you make will be a winning trade, so you must make sure that you make more money from your winning trades than you lose with your losing trades.
Also, bear in mind that on this site we talk about "trading" not "investing". Investors are in it for the long haul (years or even decades). Traders are short-term i.e. minutes, hours, days, weeks or sometimes months. We do not recommend, "day trading" (buying and selling stocks on the same day) for beginners, "swing trading" (days, weeks or months) is a more realistic approach for beginners.
If you think you are an investor not a trader then check out Warren Buffett, the most successful long-term investor of all time, who considers that the stock market is a "means for transferring money from the impatient to the patient".
Long-term investing requires researching company fundamentals i.e. their accounts, financial statements, what they produce etc… and it requires time and a belief that the company is telling you the truth, which not everybody has or does.
Short-term stock trading as understood on ATRAD Market Watch requires no understanding of what a company does. Short-term trades are based on stock charts, in the belief that the charts give signals as to where a share price is headed next.
When trading, your aim is to make a quick profit of around 10% (or less) after which you sell your shares and move on to your next trade. For this to happen you need to get to grips with stock charts and have a basic understanding of why stock prices move up or down in the short-term.
Some ill-informed people claim that stock charts are no more reliable than tealeaves or a pin. But this is based on a misunderstanding of what drives a stock price up or down. You have no control over tealeaves, their distribution is random. Charts, however, are not the result of random events; they are the result of human behavior.
If enough people buy a stock, its price will go up (usually), due to the simple law of supply and demand. If enough people sell a stock, its price will go down. Stock charts, however, can also be used to see into the future and predict when traders will start to buy or sell stocks in a company. It is often claimed that "the news comes out in the charts first" by which is meant that if a stock chart starts moving down for no apparent reason, then often, some time later, news will be announced explaining why the stock price had been moving. The reason is that there are always people who know what is going to happen before it happens and they either start selling or buying ahead of the event, or rumors are started and people in the loop take early positions.
Apart from rumors, there are other signals that can predict future stock price movements. These chart signals are used by professional traders as they tell them it is time to buy or sell.
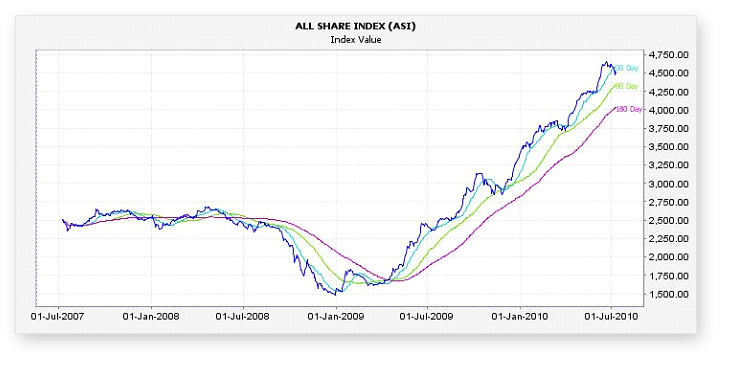
One such signal is the "200 day moving average". The 200 day m.a. is the average of a stock price over the last 200 days. Any charting service will plot it alongside the stock price. A stock falling beneath its 200 day moving average is considered to be a bad sign and professional traders will tend to sell when this happens (or just before it happens). As a result when the stock price does indeed fall below the 200 day m.a. the momentum of selling will drive the price even lower. This "proves" that the decision to sell was the right decision. It is, in fact, a self-fulfilling prophecy. When people expect something to happen, they take decisions on the basis of what they expect to happen. This ensures that what they expected to happen actually happen, thus "proving" that their decision was the right one.
This is how professional traders use charting (also known as technical analysis). As a private investor you absolutely must understand what the professional traders are looking for and what their reactions are likely to be. This, in short, is why stock charts are not like tealeaves; they are the direct result, in graphic form, of human behavior.
By using ATRAD's vast range of products namely, ATRAD online and ATRAD mobile a trader or investor will have stock information accessible 24hours a day via his Laptop, PC, I-pad or mobile-phone.